Class Profile
Students come to Mayo Clinic Alix School of Medicine to pursue an M.D. or combined M.D.-Ph.D. degree with many different backgrounds, interests, and plans for the future.
2025 admissions and acceptance statistics
The students who make up our program are proven leaders in their fields and communities, passionate about medicine and making a difference, and have a variety of personal interests beyond their careers.
The 2025 acceptance rate for incoming students at Mayo Clinic Alix School of Medicine was 3.4%. We received 5,921 applications, and of those, 204 applicants were offered acceptance to either of our programs. Mayo Clinic Alix School of Medicine enrolls approximately 94 M.D. students and 11 M.D.-Ph.D. students, which can fluctuate each year.
M.D. Program
- Applications received: 5,396
- Applicants interviewed: 712
- Acceptances issued: 175
M.D.-Ph.D. Program
- Applications received: 525
- Applicants interviewed: 70
- Acceptances issued: 29
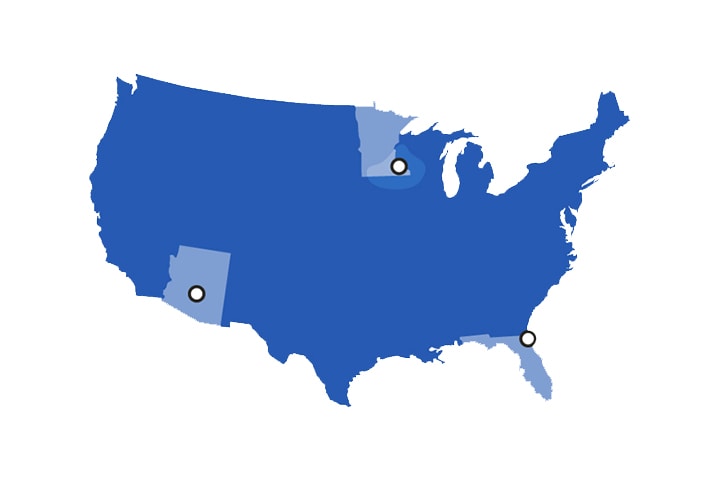
Training locations
Mayo Clinic Alix School of Medicine is a national medical school with three campus locations. In 2025, our first-year class has a total of 51 students training in Phoenix/Scottsdale, Arizona, and 58 students training in Rochester, Minnesota. In one and a half years, 16 of these students will complete their training at our campus in Jacksonville, Florida.
M.D. Program
- Arizona 4-year track: 42 students
- Minnesota 4-year track: 40 students
- Arizona/Florida track: 7 students
- Minnesota/Florida track: 9 students
M.D.-Ph.D. Program
- Arizona M.D.-Ph.D.: 2 students
- Minnesota M.D.-Ph.D.: 9 students
2025 first-year class by the numbers
The students who make up our program are proven leaders in their fields and communities, passionate about medicine and making a difference, and have a variety of personal interests beyond their careers.
Top undergraduate degree majors:
- Biology
- Neuroscience
- Human biology
- Biochemistry
- Biomedical engineering
- Microbiology
- Chemistry
Non-science degrees:
- Applied mathematics
- Business
- Computer science
- Economics
- Global health
- Nutrition
- Public health
Students identifying as:
- Women: 55
- Men: 53
- Decline: 1
- American Indian or Alaska Native: 2%
- Asian: 35%
- Black or African American: 9%
- Hispanic, Latino, or of Spanish Origin: 8%
- Middle Eastern or North African: 4%
- Native Hawaiian or Other Pacific Islander: 1%
- White: 25%
- Multiple Race/Ethnicity: 6%
- Unknown Race/Ethnicity: 10%
underrepresented in medicine relative to their numbers in the general population
median cumulative GPA
students with gap years (graduated prior to July 2024)
From 33 states
with roots in the Bahamas, Bangladesh, Canada, China, Egypt, France, Hong Kong, India, Iraq, Kenya, Korea (the Republic of), Spain, and the United Arab Emirates
13 first-generation college graduates
median MCAT score (98th percentile)
Age range of the first-year class